A tool call took 5.4 seconds. The context it required took 7 minutes 29 seconds to process.
That was the split in one instrumented run of my local agent workflow. In one run of a log-health workflow against my operations server, the remote probe itself took 5.428 seconds and exited cleanly. Before that probe could run, the same turn spent roughly 7 minutes 29 seconds processing 66,170 input tokens of required context. The fast part was the tool. The slow part was everything the workflow needed before the tool could be called.
A useful cloud agent includes more than the model response. There is a workflow around it: the skills that say how a job should be done, the MCP connections that expose tools and services, the permissions that decide what can be touched, and the browser or shell that actually performs the work. Reproducing that locally means reproducing the system, not pointing a chat window at a model API.
The workflow is the product, not the endpoint
Two pieces of that vocabulary are worth defining plainly, because most of the difficulty is here and not in the model.
MCP, the Model Context Protocol, is how an agent host exposes tools and services to a model. Each MCP server publishes a catalogue of tools the model may call, and behind those tools sit the real capabilities: files, repositories, browsers, databases, remote services. The host mediates every call, which is also where permissions get enforced.
Skills are workflow instructions. A skill says how to do a particular kind of job: which tools to use, what to gather, in what order, what the output should contain. It gives the model a procedure to follow, although the model can still miss steps and needs verification.
So the system that matters is host, model, runtime, permissions and tool connections together. The host is the application you interact with, in my case Kilo Desktop, Kilo in VS Code and AnythingLLM. The runtime serves the model. The model does the reasoning. The skills and MCP connections determine what work is even possible. An inference endpoint alone does not configure those skills, connections or permissions for the agent host.
What I am running
My serving stack is an OpenAI-compatible llama.cpp server (CUDA, build b11852) running Qwen 3 Coder Next (Q4_K_M). Model metadata reports 79.67 billion total parameters across 48 layers, and the quantized weights occupy roughly 48 GB. The machine is one RTX 4090 with 24 GB of VRAM, a Ryzen 9 3900X with 12 physical cores and 24 threads, and 128 GB of system RAM. Configured context capacity is 131,072 tokens, with an 8,192 token maximum response.
Qwen 3 Coder Next is a mixture-of-experts model. That means it stores many separate expert weight sets and activates only a subset of them per token. The stored weights are therefore large even though the computation per token touches a fraction of them. For this hardware decision, the stored weight size matters: about 48 GB even after quantization.
Why the model does not fit on the GPU
Roughly 48 GB of quantized weights against 24 GB of VRAM is an arithmetic problem, not a tuning problem. Q4_K_M quantization reduces weight storage at a precision and quality tradeoff, but it does not make this model fit in 24 GB, especially once context and runtime buffers need VRAM too.
The resolution is a split placement. The expert weights from the first 32 of the 48 layers are assigned to the CPU/system-RAM side; other tensors remain on the GPU, with a bounded GPU expert cache. To be precise, this is not 32 complete layers running only on the CPU: in a mixture-of-experts model those layers hold expert weights, and it is the expert weights from those first 32 layers that live in system RAM.
Alongside that: a 1,024 MiB expert GPU cache, a Q8 KV cache and Flash Attention. Model weights are only part of GPU memory use. The runtime also needs working buffers and attention state, often called the KV cache. Q8 controls the storage precision of supported cache tensors. The 1 GiB expert cache and Flash Attention are further memory/computation tradeoffs; their individual contribution was not isolated in this run.
Why each piece is here
These are practical choices for one machine and one workload, not benchmark-proven optima.
| Choice | Rationale | Qualification |
|---|---|---|
| llama.cpp runtime | Exposes explicit quantization and layer placement controls, and serves an OpenAI-compatible API the agent host can consume | A runtime, not a model; changing it does not make the same model smarter |
| Coding-oriented MoE model | An attempt to support a real task and tool workload rather than a chat demo | Not proven equal to frontier cloud models; earlier local runs still needed human correction |
| Q4_K_M quantization | Reduces weight storage enough to make hybrid placement viable | A precision and quality tradeoff, not a free win |
| CPU and GPU split | VRAM is finite and the weights exceed it | Expert weights from the first 32 of 48 layers live in system RAM; the rest runs on the GPU |
| 128K context ceiling | Headroom for instructions, skill and tool definitions, task input, tool results and output | A configured capacity, not a per-turn requirement |
| One concurrent request, 12 CPU threads | Contains memory demand against available RAM and physical cores | Not demonstrated optimal for other workloads |
| Native Windows serving | Avoided the WSL VM's 32 GB RAM cap and the model-loading friction through Windows-mounted files | Kilo's own Linux operational commands still run inside WSL |
What one run actually did
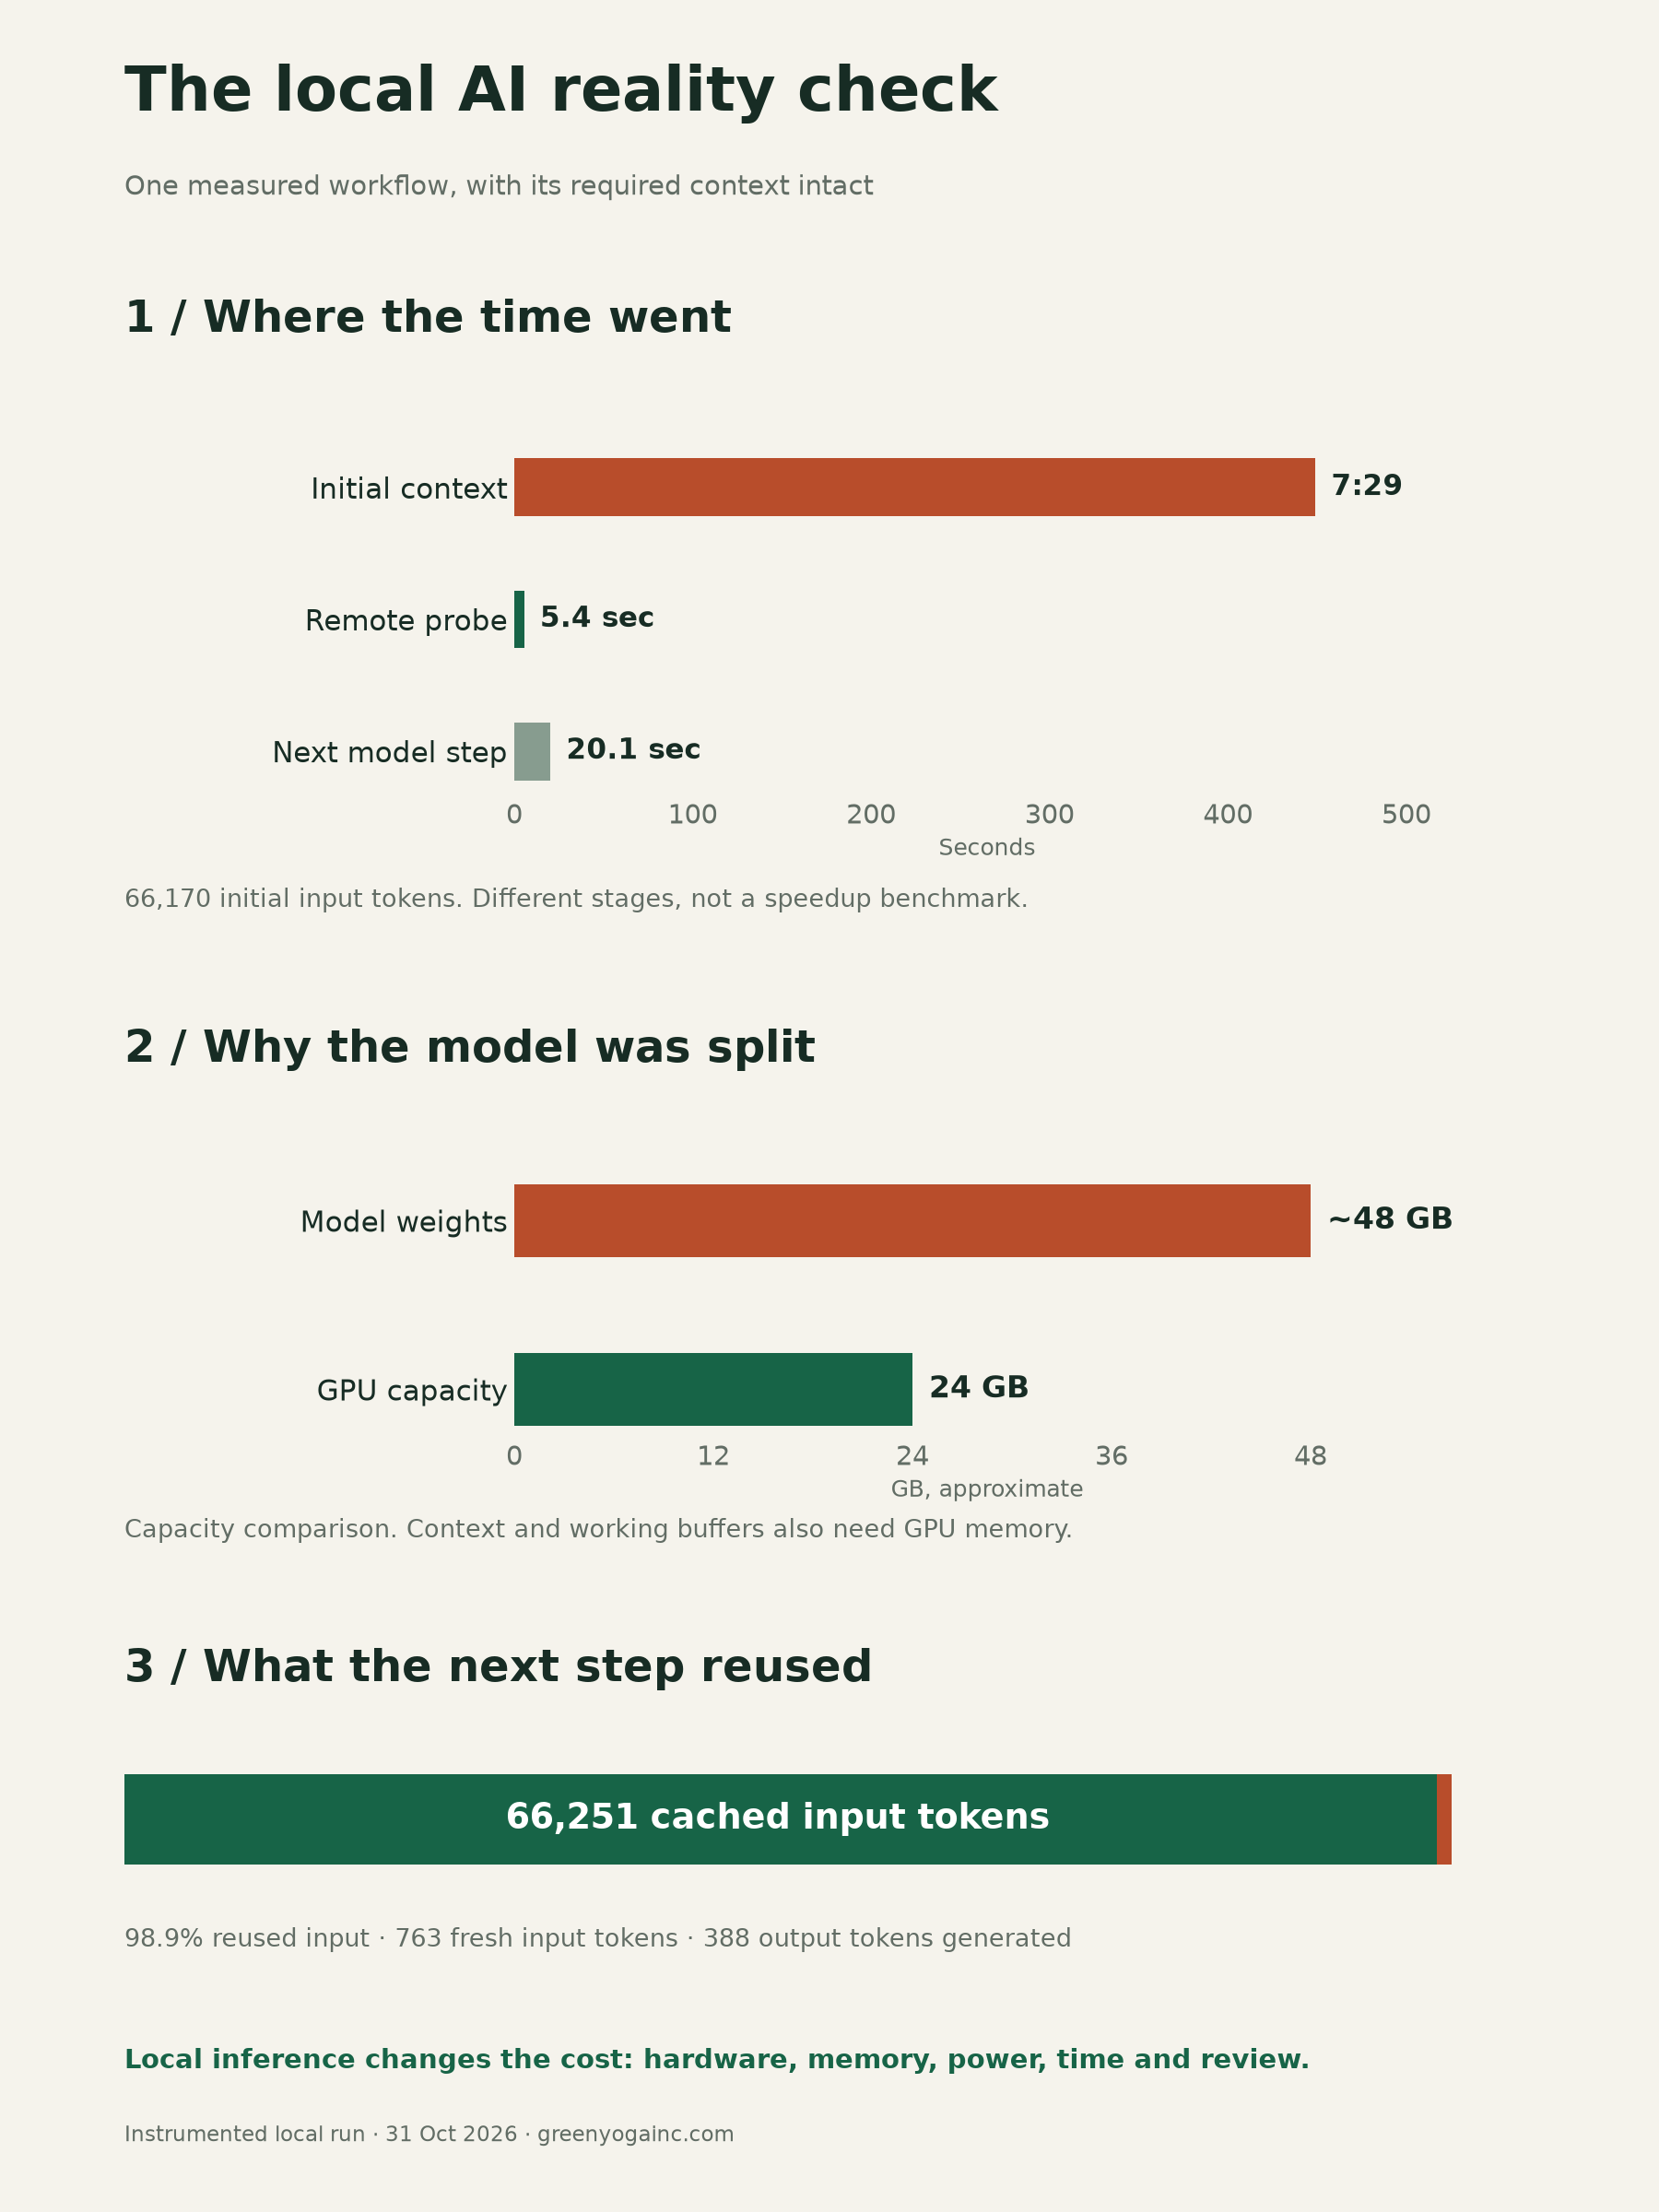
| Stage | Duration | Detail |
|---|---|---|
| Processing the input and context | 448.92 s (7 min 29 s) | 66,170 initial input tokens, about 147 input tokens/sec effective |
| Remote log-health probe | 5.428 s | Exit code 0, against my operations server |
| Follow-up model response | 20.1 s | 66,251 input tokens reused, 763 fresh, 388 output tokens, about 98.9% reused |
These are three different stages of one run, not like-for-like comparisons. The 448.92 seconds is cold processing of a large context, observed once on one workflow. The 5.428 seconds is the remote probe doing its work. The 20.1 seconds is a second model step after the tool returned. Reading 449 seconds against 20.1 seconds as an acceleration of the same task would be wrong, because the work was different and the second step inherited a warm prefix.
Where the reuse came from
That follow-up step reused 66,251 input tokens and processed 763 fresh ones, roughly 98.9% reused. Two different mechanisms are easy to conflate here, so it is worth separating them. KV caching stores attention state so prior tokens do not have to be recomputed in the same way at every generation step; Q8 is a storage-precision choice. Prefix reuse is a behaviour: the engine noticed that the beginning of the request matched what it had already processed and skipped re-processing that part. Neither shrinks the model weights, and neither is a cloud billing discount. Input cache accounting on a cloud provider is a separate mechanism with its own rules and rates.
Availability is a separate problem
On October 31, 2026, my Kilo Desktop session sat at a spinner, so I asked for the stuck session to be investigated. The cause was not model quality, context size or a tool error. The local model server was off. Kilo kept retrying and receiving ECONNREFUSED, and the spinner never made that cause legible.
Starting the server restored the existing session. No context needed to be discarded and no work needed to be redone. The durable fix was an on-demand launcher: start the server, wait for readiness, then open Kilo. Nothing was added to Windows sign-in, which I preferred on a machine I also use interactively. The llama.cpp and Qwen setup itself was already in place before this; the incident changed how the server gets started, not how the model is served.
Worth naming because it is the opposite lesson from the timing above. A fast model on an unavailable server produces nothing at all.
Prompt cost, honestly
The prompt in this run was large because the workflow demanded it. Instructions, skill definitions, tool definitions, the task, and room for tool results add up, and I have no interest in stripping skills or MCP connections out to make a number look better. A benchmark built on a gutted workflow does not describe a working agent.
So compare the cost categories honestly rather than collapsing them.
Cloud plans can bill input tokens, output tokens and cached input differently. The uncached input term is roughly input tokens divided by one million, times the provider's input price per million. Output billing and any cache discounts depend on the provider and plan. Actual billing therefore depends on which provider and which pricing tier, and I will not invent a dollar figure for it.
Local inference removes a per-token API charge for that local model. It does not remove charges for paid tools or remote services, and it is not free. The costs are the hardware, the memory and VRAM capacity, the power draw, the maintenance of the setup, the wall-clock time you spend waiting for it, and the human review of the output. Those costs are real and they do not shrink because inference is local.
One point that gets lost: local inference does not make remote MCP calls local or offline. My tools still reach remote services over the network. The work that leaves my machine is the tool traffic, and the model deciding what to call is only one part of the exposure.
Also keep 128K context capacity separate from 66,170 tokens processed. The first is a setting, the second is what this turn actually sent. Neither is the same as billable tokens, and neither is the same as task-completion cost.
What this run shows, and what it does not
The observed outcome was modest and real: the live skill probe completed against my operations server, Kilo produced a report, and the report came back with evidence for a human to review. The probe and response finished. That alone does not prove that every skill instruction was followed or every conclusion was correct.
That is the criterion I actually care about. Completion and correctness, not speed. Waiting seven and a half minutes is an acceptable outcome when the agent follows its skill, calls the right tools and returns something reviewable. An unfinished answer has no value for this workflow.
It does not follow that this setup is generally reliable, that it matches a frontier cloud model, or that the timings here predict your own. One run is one run. And a chart of prompt-processing time measures the cost of feeding the model, not the quality of what it produced. Completion, output quality, and the cost of review determine whether the workflow is worth running.
If you are running agent work locally, what is your prompt-processing budget, and how do you decide whether a slow turn is worth waiting for?
Evidence note: These figures come from one user's single instrumented local run on October 31, 2026, with approximate timings on one real workflow. They are not a standardized benchmark, not a controlled Ollama versus llama.cpp comparison, and not a cloud-versus-local performance or cost comparison.